OpsMgr 2012 UNIX/Linux Authoring Templates: Shell Command
January 30, 2012 1 Comment
Many of the OpsMgr authoring examples for UNIX/Linux monitoring that I have described on this blog are based on the use of the WSMan Invoke modules to execute shell commands. This is a really powerful mechanism to extend the capabilities of Operations Manager monitoring, and the 2012 version of Operations Manager includes a new set of templates allowing the creation of rules, monitors, and tasks using UNIX/Linux shell commands directly from the Authoring pane of the console.
The new templates are:
Monitors
- UNIX/Linux Shell Command Three State Monitor
- UNIX/Linux Shell Command Two State Monitor
Rules
- UNIX/Linux Shell Command (Alert)
- UNIX/Linux Shell Command (Performance)
Tasks
- Run a UNIX/Linux Shell Command
Note: For the OpsMgr 2012 Release Candidate, the Shell Command Template MP needs to be downloaded and imported. In the final release, it will be imported by default.
Underneath the covers, all of these templates use the ExecuteShellCommand method of the agent’s script provider with the WSMan Invoke module. This method executes the command and outputs StdOut, StdErr, and ReturnCode. The command can be a path to a simple command, a command or script existing on the managed computer, or a “one-liner” script (a shell script condensed to one line with pipes and semi-colons). The templates also allow you to select whether to run with the nonprivileged action account, or the privileged account (which also supports sudo elevation).
If you’ve done this kind of UNIX/Linux authoring in 2007 R2, you will quickly see how much easier and faster this can be done in 2012.
To show the use of these templates, I have put together an MP authoring walkthrough for monitoring BIND DNS servers on Linux. This entire MP will be created in the Operations Console, with no XML editing!
Walkthrough: Monitoring BIND on Linux
Before starting on the MP implementation, let’s have a look at what we might want to monitor to check health of a BIND DNS server. Some basic metrics would be:
- Daemon status: if the named daemon is not running, it’s a pretty good indication that BIND is not healthy!
- DNS resolution success: a good way to validate that BIND is functioning properly is to check that the server can resolve a hostname. This could be the FQDN of a local host or an Internet URL (if we wanted to confirm that Internet DNS resolution was functioning properly). This can be done easily with nslookup on the BIND server itself:
- nslookup lx12.contoso.com 127.0.0.1
- nslookup http://www.microsoft.com 127.0.0.1
- Performance metrics: we can use the shell command templates to collect or monitor numeric performance data as well. For a BIND server, one performance metric we could collect is the time to resolve a name (in seconds):
/usr/bin/time -f %e nslookup lx12.contoso.com 127.0.0.1 > /dev/null
Setting up the Management Pack:
- The first step is to create a new Management Pack. In the Administration pane of the Operations Console, right-click on left-hand menu and choose Create Management Pack. Input a name and description and complete the wizard:
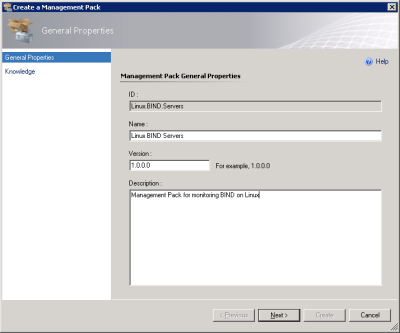
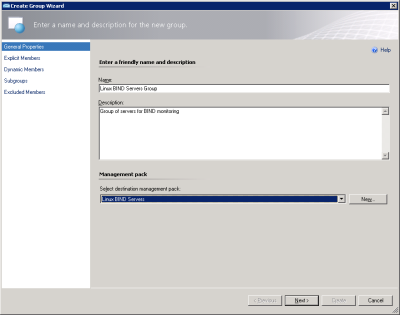
- We will use a group to control targeting of the rules and monitors in the MP, so the next step is to create a group. In the Authoring pane, right click on Groups and choose: Create a new Group. Provide a name and description, and select the target Management Pack (the one created in the previous step) and click Next.
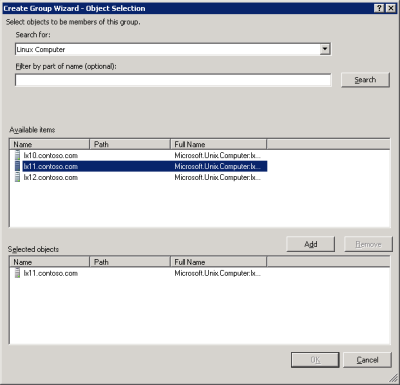
- In the Explicit Members, add the Bind hosts (filter by UNIX/Linux Computer or Linux Computer objects). Note: membership can be controlled for this group at any point in the future, so not all BIND servers have to be added at this point.
- No action is needed for the Dynamic Members, Subgroups, or Excluded Members dialogs, so click next through these to complete the group creation wizard.
- With the MP and group created, it’s on to the actual monitoring.
Creating a BIND Restart Task
The Run a UNIX/Linux Shell Command task wizard is the simplest of the shell command templates, so it is a good place to start. These steps will result in a task that restarts the BIND daemon on a Linux computer from the Operations Console.
- In the Authoring pane of the console, expand Management Pack Objects and right click Tasks. Select Create a New Task.
- Select Run a UNIX/Linux Shell Command from the Agent Tasks list, and select the target Management Pack (created in a previous step). Click Next.
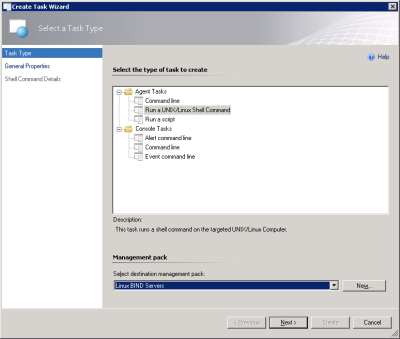
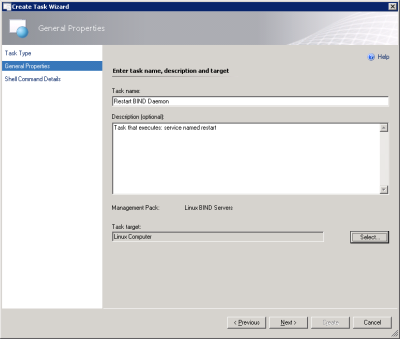
- Input a Name for the task (Restart BIND Daemon), provide a Description, and select the Target (Linux Computer). Click Next.
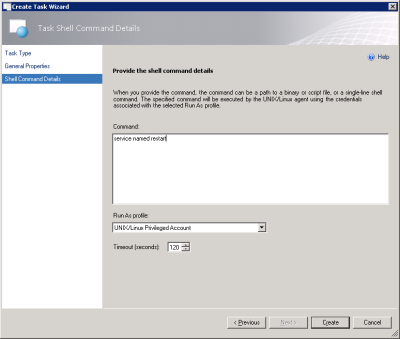
- The command to restart the BIND daemon is: service named restart. Type this into the Shell Command entry pane. Restarting a daemon is a privileged operation, so select the UNIX/Linux Privileged Account Run As profile. The default timeout of 120 seconds should be sufficient, so click Create.
- That’s all it takes to create a shell command task. When clicking on a Linux Computer instance in the monitoring view, the Restart BIND Daemon task will be listed in the right-hand task pane and can be run directly from the console.
Monitoring the BIND Daemon
- In the Authoring pane of the console, right-click Management Pack Templates and choose Add Monitoring Wizard.
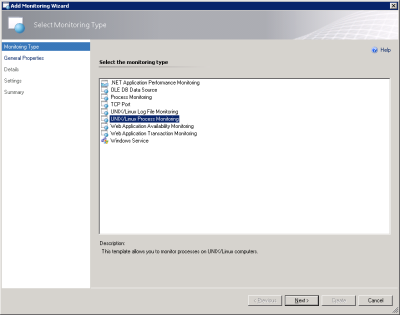
- Select UNIX/Linux Process Monitoring and click Next
- Input a Name for the monitor, a Description, and select the target Management Pack (created previously):
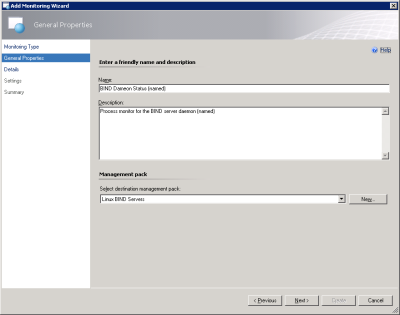
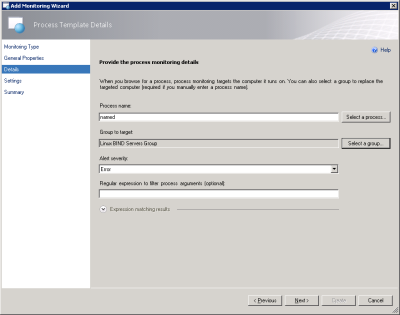
- This is a pretty simple process monitor, so simply input named for the Process name, click Select a group and select the BIND servers group created previously. An Alert severity of Error is appropriate and process argument filtering is not required, so click Next.
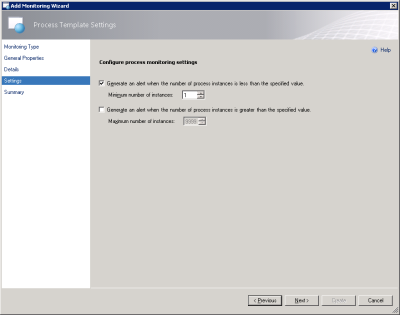
- On the Settings page, accept the defaults by clicking Next. This will generate an alert if named is not running.
- Click Create to complete the wizard.
Creating the Name Resolution Monitor
As described above, the command nslookup can be used to check name resolution health from the DNS server (specifying the local host as the server in the second argument). For example: nslookup lx12.contoso.com 127.0.0.1. The actual output of this command looks like:
lx11:/var/lib/named # nslookup lx12.contoso.com 127.0.0.1
Server: 127.0.0.1
Address: 127.0.0.1#53
Name: lx12.contoso.com
Address: 192.168.1.76
To make this command more monitor friendly, we can do a bit of pipeline parsing:
nslookup lx12.contoso.com 127.0.0.1|egrep ‘^Name:.*lx12.contoso.com’|wc -l
This shell command will return a value of 1 if the line: Name: lx12.contoso.com is found in StdOut and a value of 0 otherwise. Thusly, a value of 1 means that the name resolution attempt succeeded, and a value of 0 means that it failed.
The steps to create a monitor using this command are:
- In the Authoring pane of the console, expand Management Pack Objects and right click Monitors. Select Create a Monitor and Unit Monitor.
- Expand Scripting, then Generic and select UNIX/Linux Shell Command Two State Monitor and select the target Management Pack (created previously). Click Next.
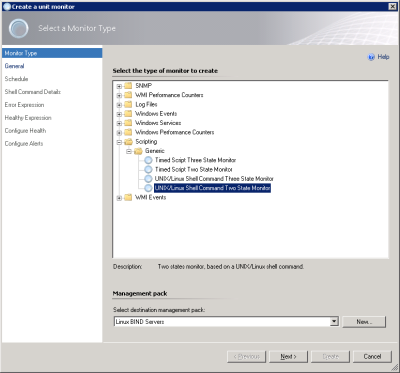
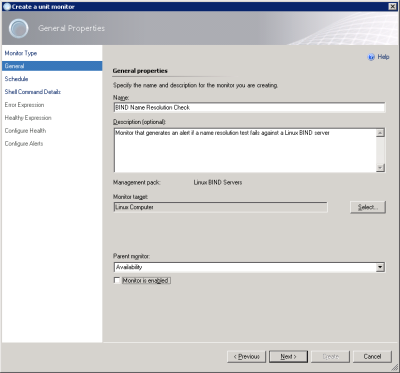
- Input a Name, Description, and Target (Linux Computer) for the monitor. Select a Parent monitor (Availability) and uncheck Monitor is enabled. Click Next.
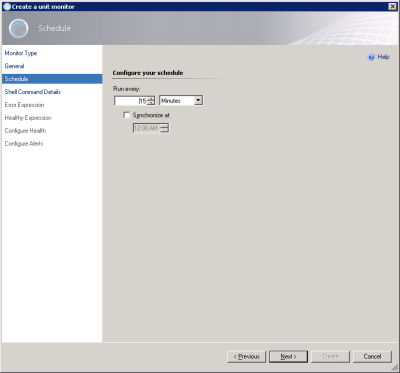
- Configure a schedule interval. For performance optimization, this should be as large of a value as reasonable. 10 or 15 minutes should be sufficient for most purposes. Click Next
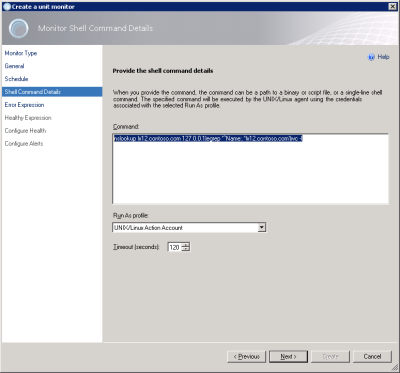
- Input the Shell Command (replacing lx12.contoso.com with the hostname to resolve):
nslookup lx12.contoso.com 127.0.0.1|egrep ‘^Name:.*lx12.contoso.com’|wc –l
The UNIX/Linux Action Account Run As profile is appropriate for this command, and 120 seconds is a sufficient value for the Timeout. Click Next.
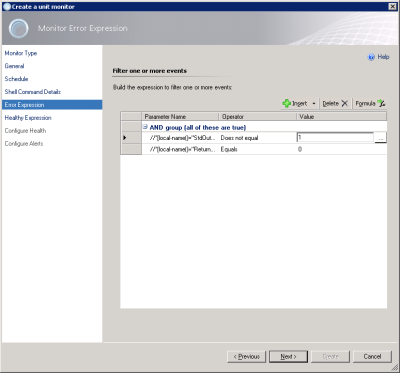
- The next page of the wizard is for configuring the Error Expression. If the conditions defined in this expression are matched, the monitor will go to an error state. The Expression Filter dialog is preloaded with the following values://*[local-name()=”StdOut”] Contains <input value>
//*[local-name()=”ReturnCode”] Equals 0With the shell command used in this example, the error state should be triggered when StdOut does not equal 1, so we can simply modify the first line to that effect. This results in an error condition that is triggered when StdOut does not equal 1 and the nslookup command executed successfully (ReturnCode equals 0).
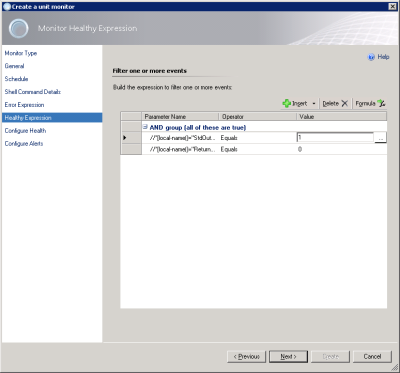
- After clicking Next, the Healthy Expression dialog is displayed. As a StdOut value of 1 indicates a successful nslookup operation using the provided shell command, simply set the first line to: //*[local-name()=”StdOut”] Equals 1 and click Next.
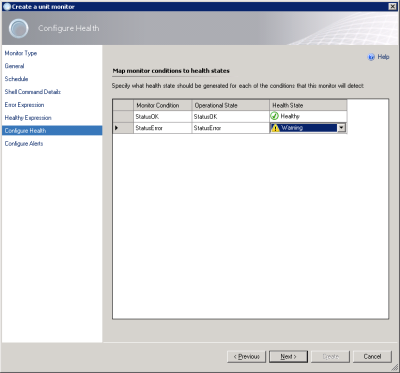
- In the Configure Health dialog, we can choose whether we want the error state to map to a Critical or Warning event by changing the Health State drop down. In this example, I will set the Health State to Warning.
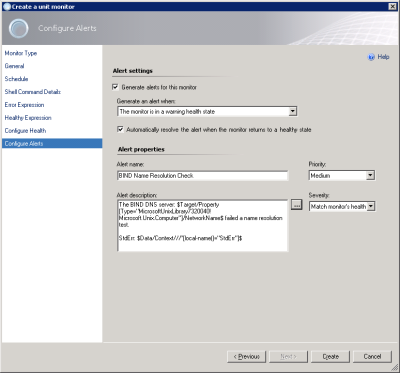
- The next dialog is for alert configuration. Check Generate alerts for this monitor and select an appropriate Priority and Severity (Match monitor’s health). Edit the Alert name if appropriate and provide an Alert description.Standard $Target$ variables can be embedded in the Alert description by clicking […]. The syntax to include data from the shell command execution is:StdOut: $Data/Context///*[local-name()=”StdOut”]$
StdErr: $Data/Context///*[local-name()=”StdErr”]$
ReturnCode: $Data/Context///*[local-name()=”ReturnCode”]$In this example, I used the following description:The BIND DNS server: $Target/Property[Type=”MicrosoftUnixLibrary7320040!Microsoft.Unix.Computer”]/NetworkName$ failed a name resolution test.StdErr: $Data/Context///*[local-name()=”StdErr”]$Click Create to complete the monitor creation.
- As this monitor targets all Linux Computers, we created it without enabling it by default. We can enable it for the group of BIND servers with an override. In the Authoring pane, expand Management Pack Objects, and click on Monitors. In the top-right of the Monitors pane, click Change Scope, and check Linux Computers from the Scope Management Pack Objects dialog. Find the monitor that was just created (BIND Name Resolution Check).

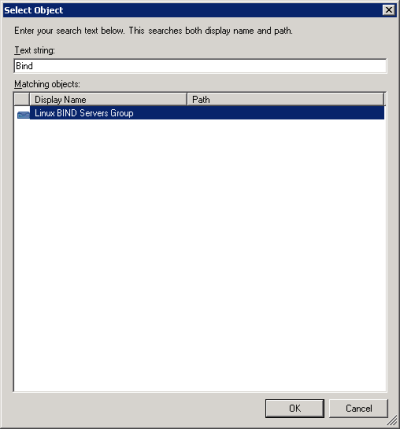
- Right-click the monitor, click Overrides, then Override the Monitor, then For a Group. Select the BIND servers group created previously and click OK.
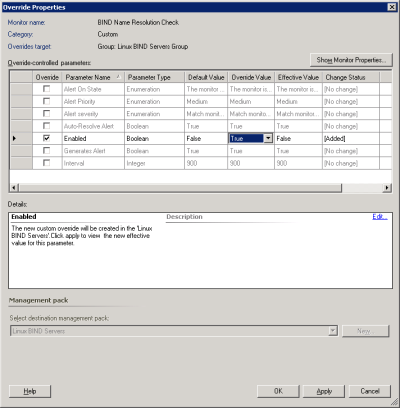
- Override the Enabled property to equal True and click OK
Creating the Name Resolution Time Performance Rule
- In the Authoring pane of the console, right-click Rules, and select Create a new rule.
- Under Collection Rules, Probe Based, select UNIX/Linux Shell Command (Performance) and select the target Management Pack (previously created). Click Next.
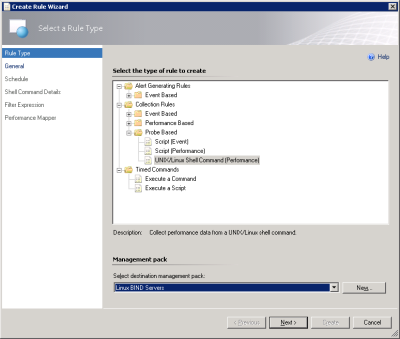
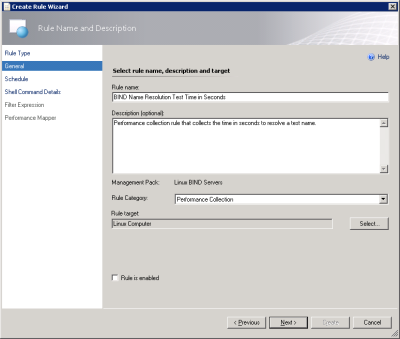
- Input the Name and Description for the rule. Select the Target (Linux Computer) and uncheck Rule is enabled. Click Next.
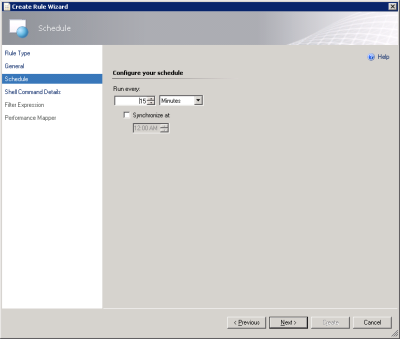
- Configure a schedule interval. For performance optimization, this should be as large of a value as reasonable. 10 or 15 minutes should be sufficient for most purposes. Click Next.
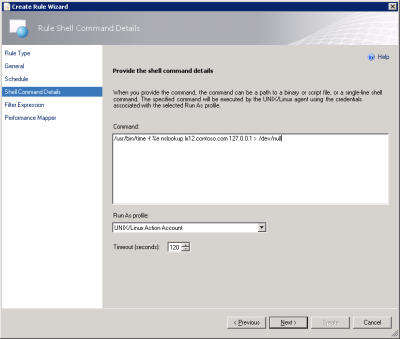
- On the Shell Command Details page, input the Shell Command:
/usr/bin/time -f %e nslookup lx12.contoso.com 127.0.0.1 > /dev/null
This command will return the time in seconds (to StdErr) that it took to complete the name resolution lookup. This is a non-privileged operation, so the UNIX/Linux Action Account is sufficient for the Run As profile. Click Next.
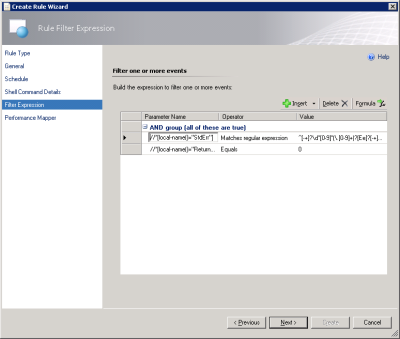
- The next page provides the opportunity to filter the output before mapping to performance data. Performance data mapping can only occur if the value is a valid double value, so the default expression syntax uses a RegExp to validate that StdOut is a numeric value, and also filters that the ReturnCode = 0, indicating a successful execution. While the default configuration is valid for most scenarios, the time command used in this shell command actually outputs its value to StdErr. So in this case, the first line of the filter should be modified to use a Parameter Name of //*[local-name()=”StdErr”]. Click Next.
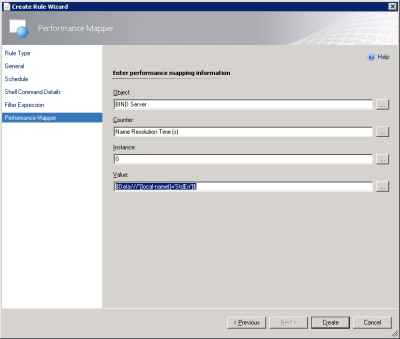
- Configure the Performance Mapper. Object, Counter, and Instance are arbitrary values that will be used to identify the performance metric in performance views and reports. The default Value of $Data///*[local-name()=”StdOut”]$ is the variable syntax for the returned StdOut, which is appropriate for most cases. Again, this needs to be modified because the time command used in this example outputs to StdErr. The StdErr variable is: $Data///*[local-name()=’StdErr’]$. Click Create.
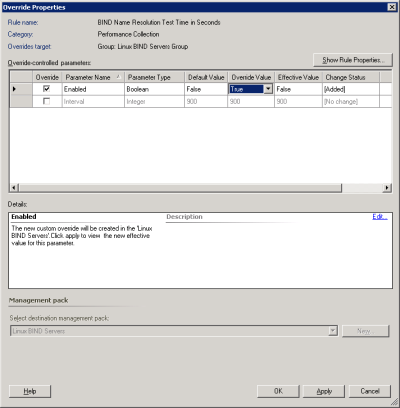
- As this rule targets all Linux Computers, we created it without enabling it by default. We can enable it for the group of BIND servers with an override. In the Authoring pane, expand Management Pack Objects, and click on Rules. In the top-right of the Rules pane, click Change Scope, and check Linux Computers from the Scope Management Pack Objects dialog. Find the rules that was just created (BIND Name Resolution Test Time in Seconds).

- Right-click the rule, click Overrides, then Override the Monitor, then For a Group. Select the BIND servers group created previously and click OK.

- Override the Enabled property to equal True and click OK.
Creating a Dashboard View
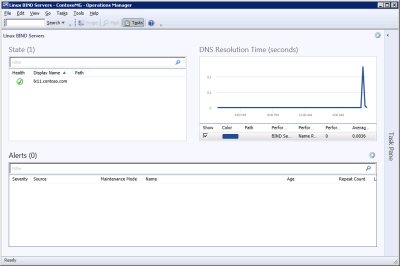
With the monitoring pieces now in place, we can move on to creating a dashboard view to show health and performance.
- In the Monitoring pane of the console, find the folder for the BIND management pack. Right-click the folder and choose New, then Dashboard View

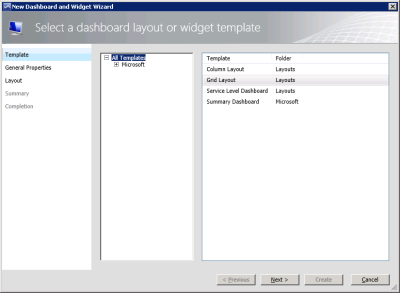
- Select Grid Layout and click Next.
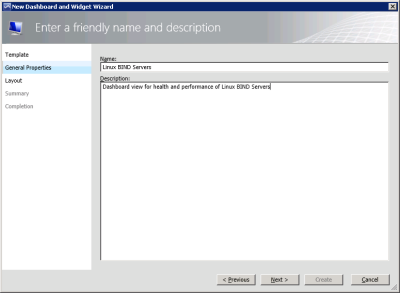
- Input a Name and Description and click Next.
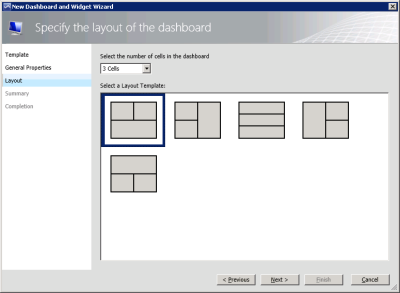
- Select 3 Cells and pick a layout. Click Next then Create.
- We now have an empty dashboard view.
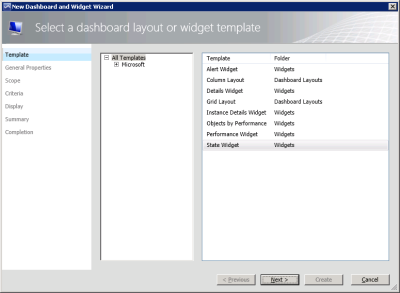
- Click Click to add widget in the top-left rectangle. Select State Widget and click Next.
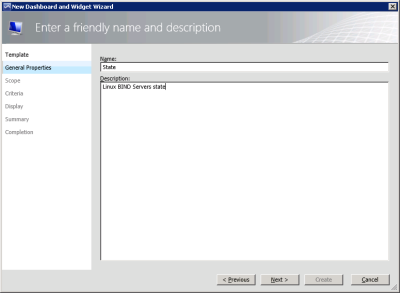
- Provide a Name and Description and click Next.
- Under Groups and objects click Add. In the search dialog, find the BIND servers group, add it to the selection list and click OK.
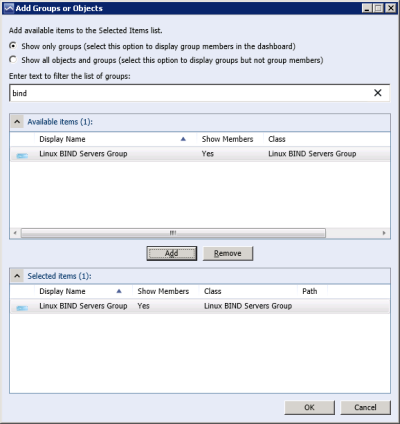
- Configure the display and filtering preferences and complete the widget wizard.
Adding the Performance Widget
- Click Click to add widget in the top-right rectangle. Select Performance Widget and click Next.
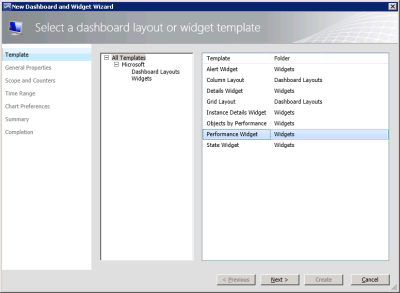
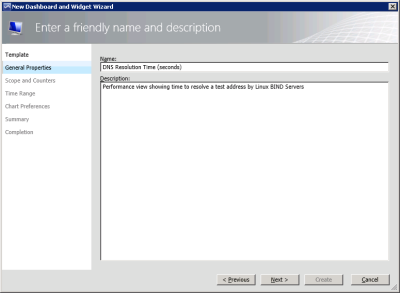
- Input a Name and Description and click Next.
- Under Select a group or object click […] and find the BIND servers group. Select the group and click OK.
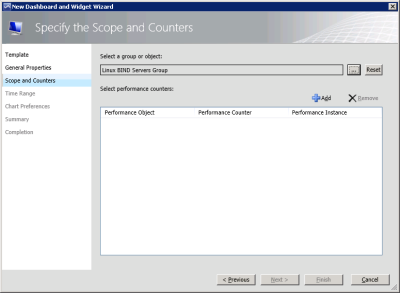
- Under Select performance counters click Add. Select the Object (BIND Server), Counter (Name Resolution Time (s)), and select (All) for Instance. Click Add to add the performance counter and click OK.
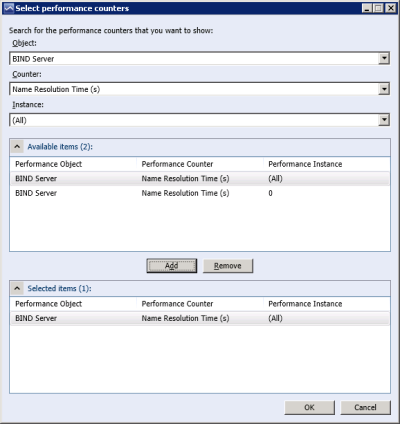
Note: only performance counters that have been collected will show up in this list. If you created the rule in the past few minutes and don’t see it listed yet, wait a little bit longer. - Select the Time Range and Display Options and complete the wizard.
Adding the Alert Widget
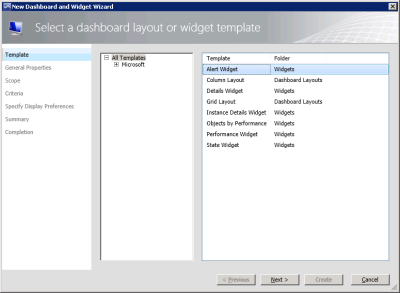
- Click Click to add widget in the bottom rectangle. Select Alert Widget and click Next.
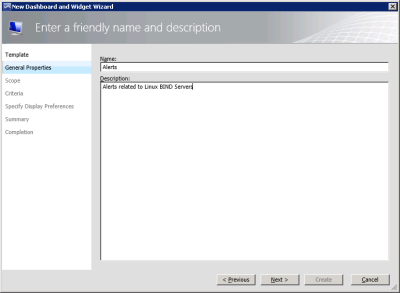
- Input a Name and Description and click Next.
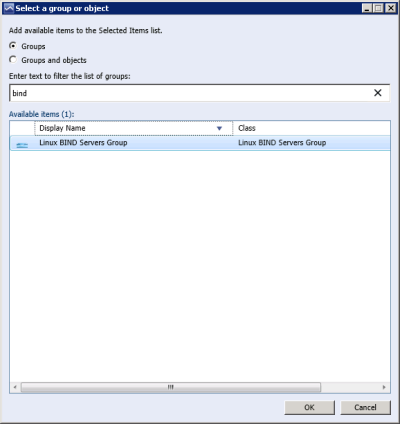
- Under Select a group or object click […], find and selecd the BIND servers group and click OK.
- Specify the criteria. Be sure to filter for only the New resolution state if you just want to see active alerts. Click Next.
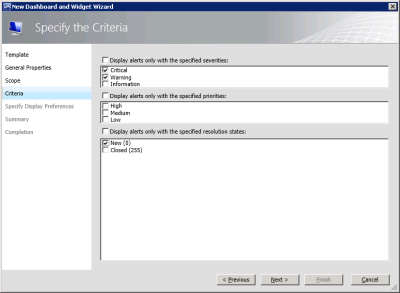
- Configure Display Preferences and complete the wizard.
The end result is a dashboard showing health and performance of monitored BIND servers:
Summary
As you can see from this walkthrough, the new template wizards for UNIX/Linux monitoring in OpsMgr 2012 are a significant improvement and make custom monitoring far easier to implement!
Pingback: UNIX/Linux MP Authoring – Dynamic Discovery of Roles & Applications | Operating-Quadrant