UNIX/Linux MP Authoring – Discovering and Monitoring Failover Clusters
July 30, 2013 Leave a comment
In my last post, I walked through creation of an MP with dynamic discovery for a UNIX/Linux application. In this post, I’ll continue to demonstrate the use of the UNIX/Linux Authoring Library examples for MP authoring, but I will take the demonstration quite a bit deeper into authoring territory – by creating an MP for monitoring of Linux failover clusters. While the base UNIX and Linux operating system Management Packs don’t have built-in detection/monitoring of failover clusters, MP Authoring can be used to build a robust cluster monitoring solution.
In this post, I will walkthrough authoring of a basic MP for monitoring a Linux failover cluster. I have two goals for this post:
- Demonstrate the use of the UNIX/Linux Authoring Library for MP Authoring scenarios
- Demonstrate the creation of a basic cluster monitoring MP that can be modified to work with other cluster technologies and monitoring requirement
This is fairly involved MP Authoring, and is intended for the author with a bit of experience.
Note: the example MP described in this blog post (and the VSAE project) can be found in the \ExampleMPs folder of the UNIX/Linux Authoring Library .zip file.
Background
The MP I am building is intended to perform discovery and monitoring of Linux failover clusters, though it could certainly be adapted to work for other cluster technologies. Prior to starting on the MP implementation, I think it is useful to conceptually model the implementation.
Regardless of the specific technology, failover clusters tend to have the same general concepts. Entities that I want to represent are:
- Cluster nodes – hosts that participate in the failover cluster
- Monitor for requisite daemons
- Monitor for quorum state
- Cluster – a “group,” containing the member nodes as well as clustered resources
- Roll-up monitors describing the total state of the cluster
- Service – a clustered service, such as a virtual IP or Web server
- Monitor each service for availability
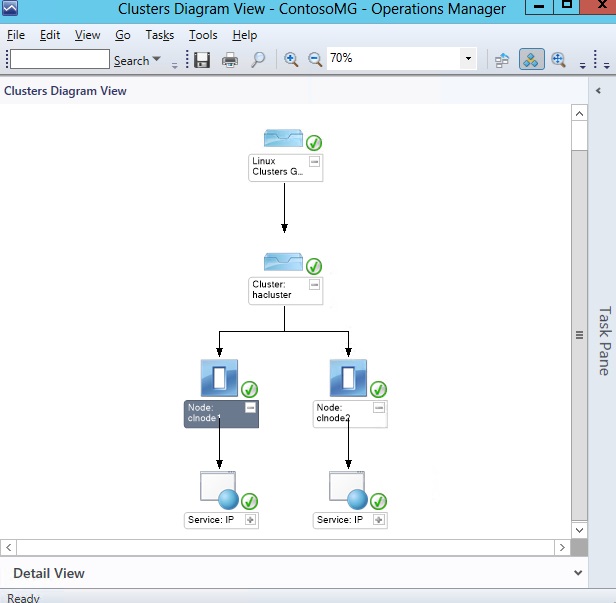
These conceptual elements will need to be described in Management Pack ClassTypes and corresponding RelationshipTypes. A basic diagram of my intended implementation looks like:

Tools and Commands
For both dynamic discovery of the cluster nodes, as well as monitoring of the cluster resource status, I leveraged the clustat utility.
As an example, the clustat output in my test environment, with two nodes and a single virtual IP address as a service, looks like:
[monuser@clnode1 ~]$ sudo clustat Cluster Status for hacluster @ Tue Jul 23 19:24:47 2013 Member Status: Quorate Member Name ID Status ------ ---- ---- ------ clnode1 1 Online, Local, rgmanager clnode2 2 Online, rgmanager Service Name Owner (Last) State ------- ---- ----- ------ ----- service:IP clnode1 started |
As you can see, the output here can be parsed and used in discovery of cluster nodes, cluster, and services, while also providing health information about the cluster nodes, cluster, and services. Depending on versions, clustat may require privileges (i.e. sudo), but it has the advantage of being a status reporting tool that is not used in cluster configuration, so it is a useful command line tool for monitoring purposes.
Creating the MP
Getting Started
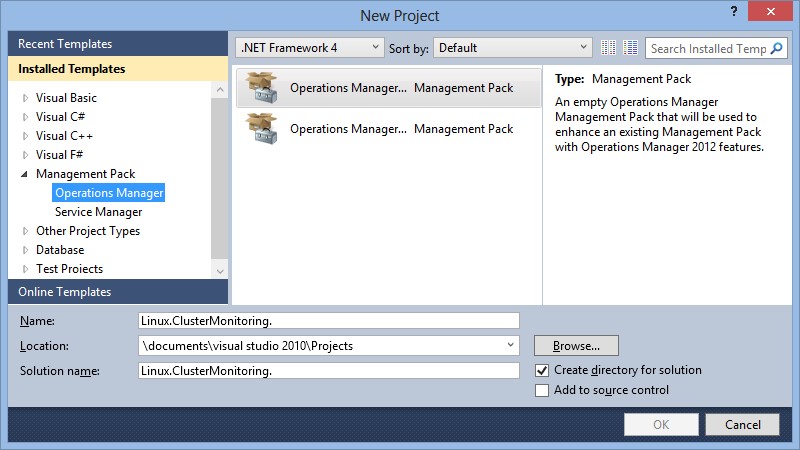
Just like with my previous example, starting off on this MP involves creating a new Management Pack project with the VSAE:
Following the direction in the Getting Started documentation for the UNIX/Linux Authoring Library, I then set up MP references and aliases. The suggested references in the Getting Started documentation are mostly sufficient, but I added Microsoft.Linux.Library.mp (with an alias of Linux) as well in order to target discoveries to the Microsoft.Linux.Computer class.
| Management Pack ID | Alias |
| Microsoft.Linux.Library | Linux |
| Microsoft.SystemCenter.DataWarehouse.Library | SCDW |
| Microsoft.SystemCenter.Library | SC |
| Microsoft.SystemCenter.WSManagement.Library | WSM |
| Microsoft.Unix.Library | Unix |
| Microsoft.Windows.Library | Windows |
| System.Health.Library | Health |
| System.Library | System |
| System.Performance.Library | Perf |
| Unix.Authoring.Library | UnixAuth |
Defining the Class and Relationship Types
Earlier in this post, I described the ClassTypes and Relationships to model in the MP. To implement these, I added an Empty Management Pack fragment to the project, and defined the ClassType, RelationshipType, and DisplayString elements for this model.
In addition to the ClassTypes for the node, cluster, and service, I described an abstract class (Linux.ClusterMonitoring.Component) to use as a base for the “component classes.” I also implemented a SecureReference (a.k.a. Run As Profile) called Linux.ClusterMonitoring.Account. This will allow for the specification of a particular account to run the clustat utility.
<ManagementPackFragment SchemaVersion="2.0" xmlns:xsd="http://www.w3.org/2001/XMLSchema"><TypeDefinitions>
|
Discoveries
The discovery rules for this management pack will firstly discover cluster nodes (by targeting all Linux computers), and then discover the related components – the cluster itself and the clustered services. I arranged all of the discoveries into one Management Pack Fragment.
Discovering the Cluster Nodes
The discovery for the Cluster Node class instances is quite similar to the Discovering a UNIX/Linux Role example. However, in this Discovery Rule, I used a slightly different DataSource: Unix.Authoring.TimedShellScript.PropertyBag.Discovery.DataSource. This DataSource uses a shell script (via the ExecuteScript method) and passes StdOut, StdErr, and ReturnCode as parameters to a subsequent PowerShellPropertyBagProbe module. This combination allows for quite a bit of flexibility both in the extraction of data (with the shell script) and the parsing of the output (with the PowerShell script). The Discovery rule targets all Linux Computer instances, and runs a shell script that checks for the existence of clustat. If clustat exists, it is run and the output is parsed to identify the local node’s name and cluster name, which are returned as StdOut. The StdOut is parsed by the PowerShell script to split the values, check that both the cluster and node names are not null, and then return them as a PropertyBag. These properties are then used to set the instance properties.
<!-- Discover Cluster Nodes --> <Discovery ID="Linux.ClusterMonitoring.Node.Discovery" Target="Linux!Microsoft.Linux.Computer" Enabled="true" ConfirmDelivery="false" Remotable="true" Priority="Normal"> <Category>Discovery</Category> <DiscoveryTypes> <DiscoveryClass TypeID="Linux.ClusterMonitoring.Node"> <Property TypeID="Linux.ClusterMonitoring.Node" PropertyID="NodeName" /> <Property TypeID="Linux.ClusterMonitoring.Node" PropertyID="ClusterName" /> </DiscoveryClass> </DiscoveryTypes> <DataSource ID="DS" TypeID="UnixAuth!Unix.Authoring.TimedShellScript.PropertyBag.Discovery.DataSource"> <Interval>28800</Interval> <TargetSystem>$Target/Property[Type="Unix!Microsoft.Unix.Computer"]/NetworkName$</TargetSystem> <ShellScript> <![CDATA[#!/bin/bashif [ -x /usr/sbin/clustat ]then soutput=`clustat` NODENAME=`printf "${soutput}" |grep ', Local'|awk '{print $1}'` if [ -n "${NODENAME}" ] then CLUSNAME=`printf "${soutput}"|grep 'Cluster Status for' |awk '{print $4}'` echo "${NODENAME};${CLUSNAME}" fifi]]> </ShellScript> <ScriptArguments></ScriptArguments> <Timeout>60</Timeout> <UserName>$RunAs[Name="Linux.ClusterMonitoring.Account"]/UserName$</UserName> <Password>$RunAs[Name="Linux.ClusterMonitoring.Account"]/Password$</Password> <PSScriptName>ParseClusterNode.ps1</PSScriptName> <PSScriptBody> <![CDATA[param([string]$StdOut,[string]$StdErr,[string]$ReturnCode)if ($ReturnCode -eq "0"){$api = New-Object -comObject 'MOM.ScriptAPI'$bag = $api.CreatePropertyBag()$sNode = $StdOut.split(";")[0]$sCluster = $StdOut.split(";")[1]if (($sNode -ne $null) -and ($sCluster -ne $null)){ $bag.AddValue("ClusterName","$sCluster") $bag.AddValue("NodeName","$sNode")}$bag}]]> </PSScriptBody> <FilterExpression> <RegExExpression> <ValueExpression> <XPathQuery>Property[@Name='NodeName']</XPathQuery> </ValueExpression> <Operator>MatchesRegularExpression</Operator> <Pattern>^[a-z]</Pattern> </RegExExpression> </FilterExpression> <ClassId>$MPElement[Name="Linux.ClusterMonitoring.Node"]$</ClassId> <InstanceSettings> <Settings> <Setting> 9pt;"><Name>$MPElement[Name='Unix!Microsoft.Unix.Computer']/PrincipalName$</Name> <Value>$Target/Property[Type="Unix!Microsoft.Unix.Computer"]/PrincipalName$</Value> </Setting> <Setting> <Name>$MPElement[Name='Linux.ClusterMonitoring.Node']/NodeName$</Name> <Value>$Data/Property[@Name='NodeName']$</Value> </Setting> <Setting> <Name>$MPElement[Name='Linux.ClusterMonitoring.Node']/ClusterName$</Name> <Value>$Data/Property[@Name='ClusterName']$</Value> </Setting> <Setting> <Name>$MPElement[Name='System!System.Entity']/DisplayName$</Name> <Value>Node: $Data/Property[@Name='NodeName']$</Value> </Setting> </Settings> </InstanceSettings> </DataSource> </Discovery>
|
Discovering the Cluster and Relationships
The model I outlined for this MP involves the Cluster (a group) containing the cluster nodes, which in turn host the clustered Services. Because the cluster name (key property of the Cluster class) is discovered as a property of the Cluster Node instances, fairly simple Class and Relationship Snapshot Data Mapper condition detection modules can be used to implement the discovery.
The cluster Discovery rule uses the Unix.Authoring.ScheduledClassSnapshotDataMapper DataSource. This Discovery targets the Cluster Node class, and dynamically creates Cluster instances using the key property of the Cluster name (which is a property discovered for the Cluster Node).
<!-- Discover Cluster --> <Discovery ID="Linux.ClusterMonitoring.Cluster.Discovery" Target="Linux.ClusterMonitoring.Node" Enabled="true" ConfirmDelivery="false" Remotable="true" Priority="Normal"> <Category>Discovery</Category> <DiscoveryTypes> <DiscoveryClass TypeID="Linux.ClusterMonitoring.Cluster"> <Property TypeID="Linux.ClusterMonitoring.Cluster" PropertyID="ClusterName" /> </DiscoveryClass> </DiscoveryTypes> <DataSource ID="DS" TypeID="UnixAuth!Unix.Authoring.ScheduledClassSnapshotDataMapper"> <Interval>28800</Interval> <ClassId>$MPElement[Name="Linux.ClusterMonitoring.Cluster"]$</ClassId> <InstanceSettings> <Settings> <Setting> <Name>$MPElement[Name='Linux.ClusterMonitoring.Cluster']/ClusterName$</Name> <Value>$Target/Property[Type="Linux.ClusterMonitoring.Node"]/ClusterName$</Value> </Setting> <Setting> <Name>$MPElement[Name='System!System.Entity']/DisplayName$</Name> <Value>Cluster: $Target/Property[Type="Linux.ClusterMonitoring.Node"]/ClusterName$</Value> </Setting> </Settings> </InstanceSettings> </DataSource> </Discovery>
|
The Cluster Contains Cluster Node relationship is discovered using the Unix.Authoring.ScheduledRelationshipSnapshotDataMapper DataSource. The relationship is defined so that clusters with a cluster name matching the cluster node’s cluster name property are contained by the cluster instance.
<!-- Cluster Contains Node --><Discovery ID="Linux.ClusterMonitoring.ClusterContainsNode.Discovery" Target="Linux.ClusterMonitoring.Node" Enabled="true" ConfirmDelivery="false" Remotable="true" Priority="Normal"><Category>Discovery</Category><DiscoveryTypes><DiscoveryRelationship TypeID="Linux.ClusterMonitoring.ClusterContainsNode.Relationship" /> </DiscoveryTypes> <DataSource ID="DS" TypeID="UnixAuth!Unix.Authoring.ScheduledRelationshipSnapshotDataMapper"><Interval>28800</Interval><RelationshipId>$MPElement[Name="Linux.ClusterMonitoring.ClusterContainsNode.Relationship"]$</RelationshipId><SourceTypeId>$MPElement[Name="Linux.ClusterMonitoring.Cluster"]$</SourceTypeId><TargetTypeId>$MPElement[Name="Linux.ClusterMonitoring.Node"]$</TargetTypeId><SourceRoleSettings> <Settings> <Setting> <Name>$MPElement[Name='Linux.ClusterMonitoring.Cluster']/ClusterName$</Name> <Value>$Target/Property[Type="Linux.ClusterMonitoring.Node"]/ClusterName$</Value> </Setting> </Settings></SourceRoleSettings><TargetRoleSettings> <Settings> <Setting> <Name>$MPElement[Name='Unix!Microsoft.Unix.Computer']/PrincipalName$</Name> <Value>$Target/Host/Property[Type="Unix!Microsoft.Unix.Computer"]/PrincipalName$</Value> </Setting> <Setting> <Name>$MPElement[Name='Linux.ClusterMonitoring.Node']/NodeName$</Name> <Value>$Target/Property[Type="Linux.ClusterMonitoring.Node"]/NodeName$</Value> </Setting> <Setting> <Name>$MPElement[Name='Linux.ClusterMonitoring.Node']/ClusterName$</Name> <Value>$Target/Property[Type="Linux.ClusterMonitoring.Node"]/ClusterName$</Value> </Setting> </Settings></TargetRoleSettings><RelationshipInstanceSettings></RelationshipInstanceSettings></DataSource></Discovery>
|
Discovering the Services
The clustered services are defined in /etc/cluster/cluster.conf and are the services hosted by the cluster for failover. These are listed in the output of clustat, so a little bit of string parsing can be used to identify the services to monitor. Note: the clustat output may vary with different versions of the utility.
Service Name Owner (Last) State ------- ---- ----- ------ ----- service:IP clnode1 started |
This Service discovery targets the Cluster Node class, and parses clustat for lines matching: service:.
<!-- Discover Cluster Service --> <Discovery ID="Linux.ClusterMonitoring.Service.Discovery" Target="Linux.ClusterMonitoring.Node" Enabled="true" ConfirmDelivery="false" Remotable="true" Priority="Normal"> <Category>Discovery</Category> <DiscoveryTypes> <DiscoveryClass TypeID="Linux.ClusterMonitoring.Service"> <Property TypeID="Linux.ClusterMonitoring.Service" PropertyID="ServiceName" /> </DiscoveryClass> </DiscoveryTypes> <DataSource ID="DS" TypeID="UnixAuth!Unix.Authoring.TimedShellScript.PropertyBag.Discovery.DataSource"> <Interval>28800</Interval> <TargetSystem>$Target/Host/Property[Type="Unix!Microsoft.Unix.Computer"]/NetworkName$</TargetSystem> <ShellScript> <![CDATA[ #!/bin/bash clustat |grep -e 'service:' |awk '{print $1}'|tr '\n' ';' ]]> </ShellScript> <ScriptArguments></ScriptArguments> <Timeout>60</Timeout> <UserName>$RunAs[Name="Linux.ClusterMonitoring.Account"]/UserName$</UserName> <Password>$RunAs[Name="Linux.ClusterMonitoring.Account"]/Password$</Password> <PSScriptName>ParseServices.ps1</PSScriptName> <PSScriptBody> <![CDATA[ param([string]$StdOut,[string]$StdErr,[string]$ReturnCode) if ($ReturnCode -eq "0"){ $api = New-Object -comObject 'MOM.ScriptAPI' [array]$ar= $StdOut.Split(";") foreach ($line in $ar){ $sEntityType = $Line.split(":")[0].ToLower() $sEntityName = $line.split(":")[1] If ($sEntityType -eq "service"){ $bag = $api.CreatePropertyBag() $bag.AddValue("Type","$sEntityType") $bag.AddValue("Name","$sEntityName") $bag } } } ]]> </PSScriptBody> <FilterExpression> <RegExExpression> <ValueExpression> <XPathQuery>Property[@Name='Type']</XPathQuery> </ValueExpression> <Operator>MatchesRegularExpression</Operator> <Pattern>^service$</Pattern> </RegExExpression> </FilterExpression> <ClassId>$MPElement[Name="Linux.ClusterMonitoring.Service"]$</ClassId> <InstanceSettings> <Settings> <Setting> <Name>$MPElement[Name='Unix!Microsoft.Unix.Computer']/PrincipalName$</Name> <Value>$Target/Host/Property[Type="Unix!Microsoft.Unix.Computer"]/PrincipalName$</Value> </Setting> <Setting> <Name>$MPElement[Name='Linux.ClusterMonitoring.Node']/NodeName$</Name> <Value>$Target/Property[Type="Linux.ClusterMonitoring.Node"]/NodeName$</Value> </Setting> <Setting> <Name>$MPElement[Name='Linux.ClusterMonitoring.Service']/ServiceName$</Name> <Value>$Data/Property[@Name='Name']$</Value> </Setting> <Setting> <Name>$MPElement[Name='System!System.Entity']/DisplayName$</Name> <Value>Service: $Data/Property[@Name='Name']$</Value> </Setting> </Settings> </InstanceSettings> </DataSource> </Discovery>
|
Populating Groups
I defined two additional groups in this MP: the Computer Group to contain Cluster Node computers, and another group to contain Cluster instances. These are useful for console views and overrides. Population of these groups can be done with a Microsoft.SystemCenter.GroupPopulator DataSource.
<!-- Discovery to populate a Computer Group with Cluster Nodes--> <Discovery ID="Linux.ClusterMonitoring.Node.Group.Discovery" Enabled="true" Target="Linux.ClusterMonitoring.Node.Group" ConfirmDelivery="false" Remotable="true" Priority="Normal"> <Category>Discovery</Category> <DiscoveryTypes> <DiscoveryRelationship TypeID="SC!Microsoft.SystemCenter.ComputerGroupContainsComputer" /> </DiscoveryTypes> <DataSource ID="GroupPopulationDataSource" TypeID="SC!Microsoft.SystemCenter.GroupPopulator"> <RuleId>$MPElement$</RuleId> <GroupInstanceId>$MPElement[Name="Linux.ClusterMonitoring.Node.Group"]$</GroupInstanceId> <MembershipRules> <MembershipRule> <MonitoringClass>$MPElement[Name="Unix!Microsoft.Unix.Computer"]$</MonitoringClass> <RelationshipClass> $MPElement[Name="SC!Microsoft.SystemCenter.ComputerGroupContainsComputer"]$ </RelationshipClass> <Expression> <Contains> <MonitoringClass>$MPElement[Name="Linux.ClusterMonitoring.Node"]$</MonitoringClass> </Contains> </Expression> </MembershipRule> </MembershipRules> </DataSource> </Discovery> <!-- Discovery to populate Clusters Group with Clusters--> <Discovery ID="Linux.ClusterMonitoring.Cluster.Group.Discovery" Enabled="true" Target="Linux.ClusterMonitoring.Cluster.Group" ConfirmDelivery="false" Remotable="true" Priority="Normal"> <Category>Discovery</Category> <DiscoveryTypes> <DiscoveryRelationship TypeID="Linux.ClusterMonitoring.ClusterGroupContainsClusters.Relationship" /> </DiscoveryTypes> <DataSource ID="GroupPopulationDataSource" TypeID="SC!Microsoft.SystemCenter.GroupPopulator"> <RuleId>$MPElement$</RuleId> <GroupInstanceId>$MPElement[Name="Linux.ClusterMonitoring.Cluster.Group"]$</GroupInstanceId> <MembershipRules> <MembershipRule> <MonitoringClass>$MPElement[Name="Linux.ClusterMonitoring.Cluster"]$</MonitoringClass> <RelationshipClass> $MPElement[Name="Linux.ClusterMonitoring.ClusterGroupContainsClusters.Relationship"]$ </RelationshipClass> </MembershipRule> </MembershipRules> </DataSource> </Discovery>
|
That completes the discoveries of class and relationship instances, and now it is time to move on to the presentation.
Console Views
In terms of presentation, my example cluster monitoring MP includes the following console views:
- Active Alerts – alerts view, targeting the Cluster class and showing active alerts
- Cluster State – state view, targeting the Cluster class
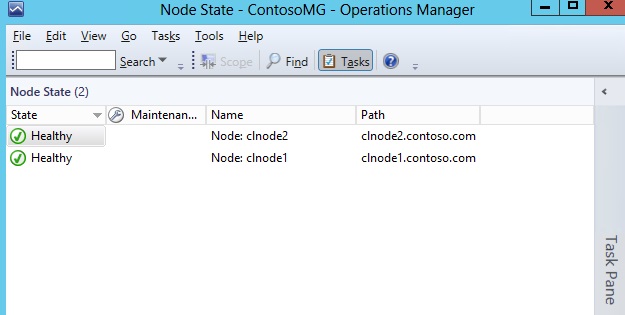
- Node State – state view, targeting the Cluster Node class
- Service State – state view, targeting the Service class
- Diagram View – diagram view, targeting the Cluster group
To implement these, I added a new Empty Management Pack fragment to the project, copied the view templates from the Authoring Library documentation, and modified the view definitions, display strings, folder, and folder items accordingly.
Monitoring
The first monitors that I want to implement in the cluster monitoring MP are daemon monitors for the requisite cluster daemons. In my example configuration, these include:
- corosync
- rgmanager
- ricci
For each of these monitors, I used the Monitor Type: Unix.Authoring.WSManEnumeration.ProcessCount.MonitorType and target the Cluster Node class. Each of these monitors is very similar in the MP implementation, so I implemented each in its own Management Pack Fragment. This makes it very easy to duplicate them and do some ‘search and replace’ to create the second and third process monitors.
The corosync monitor ends up looking like:
<ManagementPackFragment SchemaVersion="2.0" xmlns:xsd="http://www.w3.org/2001/XMLSchema"> <Monitoring> <Monitors> <!-- Daemon: corosync --> <UnitMonitor ID="Linux.ClusterMonitoring.Corosync.Monitor" Accessibility="Public" Enabled="true" Target="Linux.ClusterMonitoring.Node" ParentMonitorID="Health!System.Health.AvailabilityState" Remotable="true" Priority="Normal" TypeID="UnixAuth!Unix.Authoring.WSManEnumeration.ProcessCount.MonitorType" ConfirmDelivery="false"> <Category>AvailabilityHealth</Category> <AlertSettings AlertMessage="Linux.ClusterMonitoring.Corosync.Monitor.AlertMessage"> <AlertOnState>Error</AlertOnState> <AutoResolve>true</AutoResolve> <AlertPriority>Normal</AlertPriority> <AlertSeverity>Error</AlertSeverity> <AlertParameters> <AlertParameter1> $Target/Host/Property[Type="Unix!Microsoft.Unix.Computer"]/NetworkName$ </AlertParameter1> <AlertParameter2>$Data/Context///*[local-name()="Count"]$</AlertParameter2> </AlertParameters> </AlertSettings> <OperationalStates> <OperationalState ID="ProcessCountOK" MonitorTypeStateID="ProcessCountOK" HealthState="Success" /> <OperationalState ID="ProcessCountError" MonitorTypeStateID="ProcessCountError" HealthState="Error" /> </OperationalStates> <Configuration> <Interval>300</Interval> <TargetSystem> $Target/Host/Property[Type="Unix!Microsoft.Unix.Computer"]/NetworkName$ </TargetSystem> <ProcessName>corosync</ProcessName> <ArgumentsFilterExpression></ArgumentsFilterExpression> <MinProcessCount>1</MinProcessCount> <MaxProcessCount>9999</MaxProcessCount> </Configuration> </UnitMonitor> </Monitors> </Monitoring>
<Presentation> <StringResources> <!-- Daemon: corosync --> <StringResource ID="Linux.ClusterMonitoring.Corosync.Monitor.AlertMessage" /> </StringResources> </Presentation> <LanguagePacks> <LanguagePack ID="ENU" IsDefault="true"> <DisplayStrings>
<!-- Daemon: corosync --> <DisplayString ElementID="Linux.ClusterMonitoring.Corosync.Monitor"> <Name>Linux Cluster Process corosync Status</Name> <Description>Process monitor for the corosync daemon</Description> </DisplayString> <DisplayString ElementID="Linux.ClusterMonitoring.Corosync.Monitor.AlertMessage"> <Name>Too many or too few corosync processes</Name> <Description>The count of running instances of the corosync process on host {0} is outside of the defined threshold range. The current count is {1}</Description> </DisplayString> <DisplayString ElementID="Linux.ClusterMonitoring.Corosync.Monitor" SubElementID="ProcessCountOK"> <Name>ProcessCountOK</Name> <Description>ProcessCountOK</Description> </DisplayString> <DisplayString ElementID="Linux.ClusterMonitoring.Corosync.Monitor" SubElementID="ProcessCountError"> <Name>ProcessCountError</Name> <Description>ProcessCountError</Description> </DisplayString> </DisplayStrings> </LanguagePack>
</LanguagePacks>
</ManagementPackFragment>
|
Cluster Quorum State
Returning to the clustat output, the Member Status line reports on the quorum status for the cluster:
Cluster Status for hacluster @ Tue Jul 23 19:24:47 2013 Member Status: Quorate |
Similarly to the discovery rule implementations, Shell Script DataSources can be used to parse clustat output in order to trigger a critical state if the “Member Status” is not equal to “Quorate,” which would indicate a problem.
This monitor also targets the Cluster Node instances, but uses the Monitor Type: Unix.Authoring.ShellScript.MatchesRegExp.TwoState.MonitorType.
<ManagementPackFragment SchemaVersion="2.0" xmlns:xsd="http://www.w3.org/2001/XMLSchema ">
|
Service State
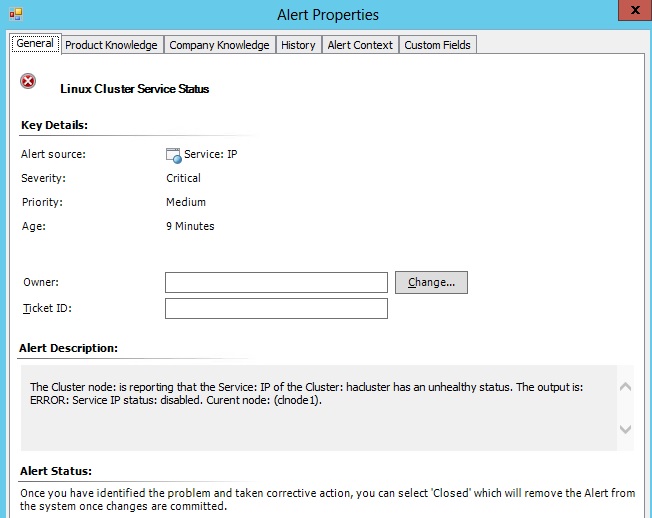
To monitor the state of a specific service, the clustat utility is used once again, but parsing for the specific line indicating the state of that service. The Service name (a property of the Service class) is passed as an argument to the shell script, which evaluates the state of the Service. This monitor targets the Cluster Node class and uses the Monitor Type: Unix.Authoring.ShellScript.MatchesRegExp.TwoState.MonitorType.
<ManagementPackFragment SchemaVersion="2.0" xmlns:xsd="http://www.w3.org/2001/XMLSchema ">
<Monitoring> <Monitors> <UnitMonitor ID="Linux.ClusterMonitoring.ServiceStatus.Monitor" Accessibility="Internal" Enabled="true" Target="Linux.ClusterMonitoring.Service" ParentMonitorID="Health!System.Health.AvailabilityState" Remotable="true" Priority="Normal" TypeID="UnixAuth!Unix.Authoring.ShellScript.MatchesRegExp.TwoState.MonitorType" ConfirmDelivery="false"> <Category>AvailabilityHealth</Category> <AlertSettings AlertMessage="Linux.ClusterMonitoring.ServiceStatus.Monitor.AlertMessage"> <AlertOnState>Error</AlertOnState> <AutoResolve>true</AutoResolve> <AlertPriority>Normal</AlertPriority> <AlertSeverity>MatchMonitorHealth</AlertSeverity> <AlertParameters> <AlertParameter1> $Target/Host/Host/Property[Type="Unix!Microsoft.Unix.Computer"]/NetworkName$ </AlertParameter1> <AlertParameter2>$Data/Context///*[local-name()="StdOut"]$</AlertParameter2> <AlertParameter3>$Target/Property[Type="Linux.ClusterMonitoring.Service"]/ServiceName$</AlertParameter3> <AlertParameter4>$Target/Host/Property[Type="Linux.ClusterMonitoring.Node"]/ClusterName$</AlertParameter4> </AlertParameters> </AlertSettings> <OperationalStates> <OperationalState ID="StatusOK" MonitorTypeStateID="StatusOK" HealthState="Success" /> <OperationalState ID="StatusError" MonitorTypeStateID="StatusError" HealthState="Error" /> </OperationalStates> <Configuration> <Interval>300</Interval> <TargetSystem> $Target/Host/Host/Property[Type="Unix!Microsoft.Unix.Computer"]/NetworkName$ </TargetSystem> <ShellScript> <![CDATA[ #!/bin/bash srvname=$1
srvstat=`clustat |grep 'service:${srvname}'` sstat=`echo $srvstat |awk '{print $3}'` snode=`echo $srvstat |awk '{print $2}'`
if [ "${sstat}" = "started" ] then echo "OK: Service ${srvname} status: ${sstat}. Curent node: ${snode}. " else
fi echo "ERROR: Service ${srvname} status: ${sstat}. Curent node: ${snode}. " ]]> </ShellScript> <ScriptArguments>$Target/Property[Type="Linux.ClusterMonitoring.Service"]/ServiceName$</ScriptArguments> <Timeout>60</Timeout> <UserName>$RunAs[Name="Linux.ClusterMonitoring.Account"]/UserName$</UserName> <Password>$RunAs[Name="Linux.ClusterMonitoring.Account"]/Password$</Password> <ErrorRegExp>^ERROR</ErrorRegExp> </Configuration> </UnitMonitor>
</Monitors>
</Monitoring> <Presentation> <StringResources> <StringResource ID="Linux.ClusterMonitoring.ServiceStatus.Monitor.AlertMessage" > </StringResources> </Presentation> <LanguagePacks> <LanguagePack ID="ENU" IsDefault="true"> <DisplayStrings> <DisplayString ElementID="Linux.ClusterMonitoring.ServiceStatus.Monitor"> <Name>Linux Cluster Service Status</Name> <Description>Monitor that alerts if a clustered Service has a status other than Started.</Description> </DisplayString> <DisplayString ElementID="Linux.ClusterMonitoring.ServiceStatus.Monitor.AlertMessage"> <Name>Linux Cluster Service Status</Name> <Description>The Cluster node: {0} is reporting that the Service: {2} of the Cluster: {3} has an unhealthy status. The output is: {1}</Description> </DisplayString> <DisplayString ElementID="Linux.ClusterMonitoring.ServiceStatus.Monitor" SubElementID="StatusOK"> <Name>StatusOK</Name> <Description>StatusOK</Description> </DisplayString> <DisplayString ElementID="Linux.ClusterMonitoring.ServiceStatus.Monitor" SubElementID="StatusError"> <Name>StatusError</Name> <Description>StatusError</Description> </DisplayString> </DisplayStrings> </LanguagePack> </LanguagePacks> </ManagementPackFragment>
|
Dependency Monitors
In order to facilitate rollup so that the Node, Cluster, and group instances reflect the state of their contained or hosted class instances, Dependency Monitors are needed. The Dependency Monitors for this model are:
- Cluster Group Depends on Cluster Availability
- Cluster Depends on Node Availability
- Node Depends on Service Availability
The implementation in the MP is pretty straightforward:
<ManagementPackFragment SchemaVersion="2.0" xmlns:xsd="http://www.w3.org/2001/XMLSchema"> <Monitoring> <Monitors> <!-- Cluster Depends on Node Availability --> <DependencyMonitor ID="Linux.ClusterMonitoring.ClusterDependsOnNodeAvailability.Monitor" Accessibility="Public" Enabled="true" MemberMonitor="Health!System.Health.AvailabilityState" ParentMonitorID="Health!System.Health.AvailabilityState" RelationshipType="Linux.ClusterMonitoring.ClusterContainsNode.Relationship" Priority="Normal" Remotable="false" Target="Linux.ClusterMonitoring.Cluster"> <Category>AvailabilityHealth</Category> <Algorithm>WorstOf</Algorithm> </DependencyMonitor>
<!-- Clusters group depends on Cluster Availability --> <DependencyMonitor ID="Linux.ClusterMonitoring.ClusterGroupDependsOnClusterAvailability.Monitor" Accessibility="Public" Enabled="true" MemberMonitor="Health!System.Health.AvailabilityState" ParentMonitorID="Health!System.Health.AvailabilityState" RelationshipType="Linux.ClusterMonitoring.ClusterGroupContainsClusters.Relationship" Priority="Normal" Remotable="false" Target="Linux.ClusterMonitoring.Cluster.Group"> <Category>AvailabilityHealth</Category> <Algorithm>WorstOf</Algorithm> </DependencyMonitor>
<!-- Cluster Node depends on Service Availability --> <DependencyMonitor ID="Linux.ClusterMonitoring.ClusterNodeDependsOnServiceAvailability.Monitor" Accessibility="Public" Enabled="true" MemberMonitor="Health!System.Health.AvailabilityState" ParentMonitorID="Health!System.Health.AvailabilityState" RelationshipType="Linux.ClusterMonitoring.ClusterNodeHostsComponent.Relationship" Priority="Normal" Remotable="false" Target="Linux.ClusterMonitoring.Node"> <Category>AvailabilityHealth</Category> <Algorithm>WorstOf</Algorithm> </DependencyMonitor>
</Monitors> </Monitoring> <LanguagePacks> <LanguagePack ID="ENU" IsDefault="true"> <DisplayStrings> <DisplayString ElementID="Linux.ClusterMonitoring.ClusterDependsOnNodeAvailability.Monitor"> <Name>Cluster Node Availability</Name> </DisplayString>
<DisplayString ElementID="Linux.ClusterMonitoring.ClusterGroupDependsOnClusterAvailability.Monitor"> <Name>Cluster Availability</Name> </DisplayString>
<DisplayString ElementID="Linux.ClusterMonitoring.ClusterNodeDependsOnServiceAvailability.Monitor"> <Name>Service Availability</Name> </DisplayString> </DisplayStrings> </LanguagePack> </LanguagePacks> </ManagementPackFragment>
|
Additional Considerations
sudo elevation
Ideally, scripts and commands used in monitoring (where status is read but not written) are usable without privilege. However, depending on the versions involved, clustat may indeed require privilege. This example makes heavy use of the ExecuteScript method of the SCX_OperatingSystem provider. This method transfers the script in the WS-Man request to the UNIX/Linux agent, which writes it to a temporary file, executes it, and then removes the temporary file. The file name pattern for the temporary will always be /tmp/scxXXXXXX, where the X’s represent random alpha characters. If elevation is required for such a script, it can be authorized in sudoers with a line such as:
monuser ALL=(root) NOPASSWD: /tmp/scx??????
Because this example MP uses clustat output almost exclusively, another option (requiring no elevation) would be to schedule a cron job that writes clustat output to a world-readable temporary file every few minutes. The MP scripts could then be modified to parse this file for state. This would allow all of the monitoring to take place without privilege use, but would require out-of-band configuration for cluster node systems (to set the cron job up).
Disabling clustered resource monitoring
When monitoring clustered resources, such as shared file systems, the default monitors in the Operating System MPs may not be appropriate. That is: if a shared file system may be mounted to different cluster nodes at different points, the out-of-the-box OS MPs will not represent this state well. A better option is to implement monitoring of the clustered resource with an MP such as the example described in this post. In this case, it is often best to simply disable the out-of-the-box monitors/rules for the clustered resource, and rely on the custom cluster MP to track the resource state.
Conclusion
I hope that this post clearly demonstrates the viability of using a custom MP to implement failover cluster monitoring for UNIX/Linux hosts with Operations Manager. As most failover cluster implementations for UNIX and Linux can be expected to have a command line status tool like clustat, this approach should be viable for many different failover cluster technologies.
Additionally, I have demonstrated the usefulness of the UNIX/Linux Authoring Library example content in authoring MPs for UNIX and Linux monitoring. I would recommend this library and documentation as the starting point for just about any custom UNIX/Linux authoring scenario.
