OpsMgr 2012 UNIX/Linux Authoring Templates: Process Monitoring
January 27, 2012 3 Comments
In Operations Manager, custom rules and monitors can be used to extensively build on the out-of-the-box Management Pack contents. Unfortunately, this kind of custom authoring for UNIX/Linux monitoring carried a steep learning curve with OpsMgr 2007 R2. However, the 2012 release of Operations Manager has some new features to enable many common UNIX/Linux authoring scenarios using templates, directly from the console. The first of these new templates I wanted to cover is the new process monitoring template.
UNIX/Linux Process Monitoring Template
Operations Manager 2007 R2 included the Unix Service Monitoring template for custom monitoring of daemons on UNIX and Linux agents. This template has been replaced in the System Center 2012 release of Operations Manager with the far more capable UNIX/Linux Process Monitoring template. The new UNIX/Linux Process Monitoring template allows more flexibility in process/daemon monitoring, including the ability to monitor for minimum and maximum process count thresholds, and the ability to filter processes on arguments in addition to the process name. For this example, I will walk through the use the UNIX/Linux Process Monitoring template to monitor a Tomcat daemon.
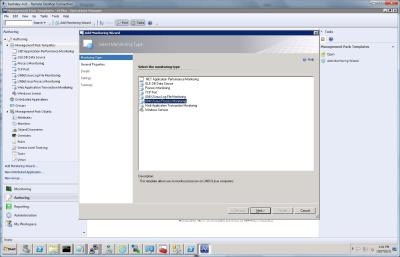
The UNIX/Linux Process Monitoring template is accessible in the Authoring Pane of the Operations Console. It can be launched with the “Add Monitoring Wizard” task under the Management Pack Templates view.
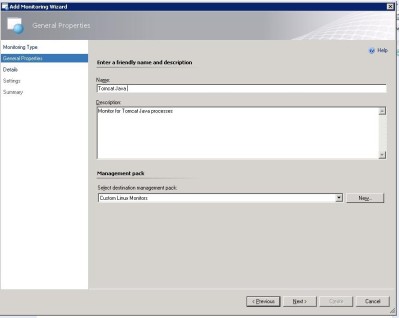
Input a name, description, and select the target management pack (where the template-created MP elements will be saved).
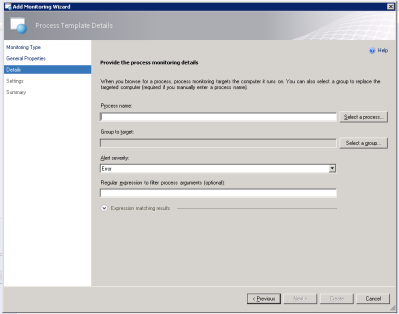
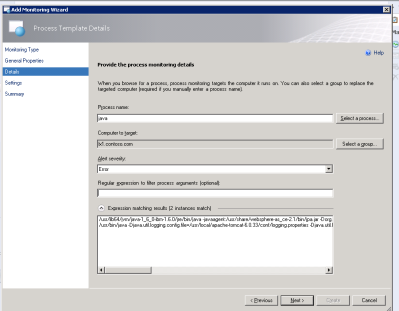
The next page is the details page, where process information is input. If you already know the process name, you can just type that in and select the group to target. Alternatively, you can click Select a Process to connect to an agent and list the currently running processes.
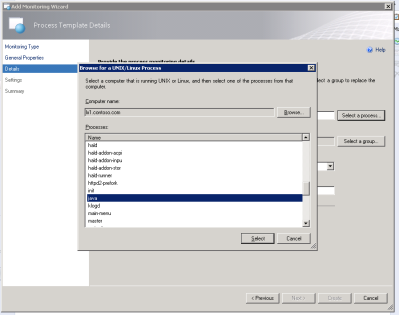
In this case, I will connect to an agent and enumerate the running processes. The Tomcat daemon is a Java process, so I select the process named: java.
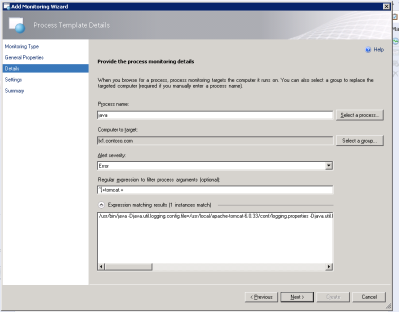
In the bottom field of the details dialog, the running processes on the agent that match the selected name are listed. This particular agent is also running WebSphere, and its process also has the name: java, which is why two java processes are listed in this field. As I only want to monitor the Tomcat daemon with this particular monitor, I don’t want the WebSphere process to affect the monitoring. While the two processes share the same name, they have different process arguments. The Regular expression to filter process arguments field allows me to input a regular expression that will be evaluated against the process arguments. Only processes that match the regular expression will be included in this monitor. So, I can input a regular expression of ^.+tomcat.+ and only processes with a name of “java” that have the string: tomcat in their arguments list will be evaluated by the monitor. The wizard filters the list of running processes on the fly to show what will be evaluated with a given regular expression.
A few notes on this functionality:
- The regular expression filtering by arguments is an optional function. If you just want to monitor processes by name, you can leave this field blank.
- The regular expression is evaluated against all arguments as one long string. That is, the arguments (argv[0] – argv[<max>]) are concatenated with a space separator, and the regular expression is evaluated against this concatenated string.
- The regular expression filtering is performed on the Windows-side (Health Service), not on the UNIX/Linux agent. Thus, .NET regular expressions are used (this differs from the log file monitoring template where the regular expression matching is performed on the UNIX/Linux agent).
- If you know the regular expression that you want to use, and you are targeting a group, you can just select a group, and type the process name and regular expression into the field without connecting to an agent. However, if you want to test the regular expression in the wizard, you need to use the Select a process function to connect to an agent and list running processes that match the selected name. Once you are satisfied with the arguments filter, you can retarget the monitor to a group by clicking Select a group. The filtering by arguments functionality works whether you are targeting a single agent or a group, but testing it requires connecting to an agent to list the running processes.
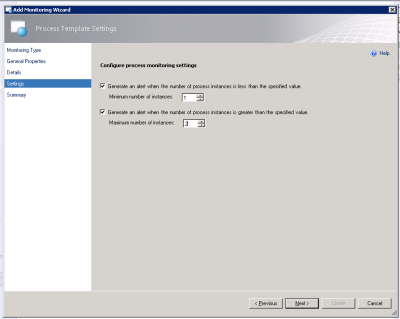
On the next page, optional minimum and maximum thresholds can be set for the acceptable count of processes that match the name and optional arguments filter. For example, to monitor that at least one instance of a process is running, set a minimum threshold of 1, to alert if any instances of a process are running, set a maximum threshold of 0. To monitor that no less than 5 and no more than 10 instances of a process is running, set a minimum threshold of 5 and a maximum of 10. Note: the process count is calculated after the optional arguments filter is applied. So in this example, the WebSphere “java” process will not be included in the process count, because the ^.+tomcat.+ filter was applied to the arguments.
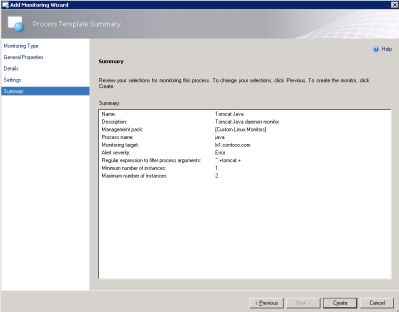
All done:
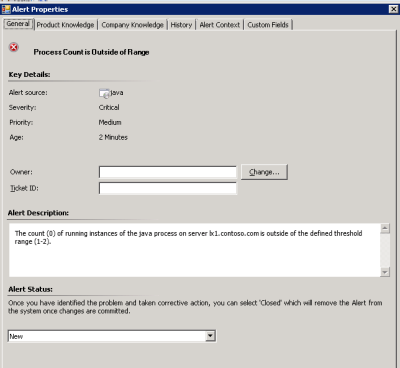
When I kill the Tomcat daemon, this is what the alert looks like:
Note:
Despite similar functionality to the Unix Service Template from 2007 R2, the new UNIX/Linux Process Monitoring template is an entirely new template. If you are upgrading from 2007 R2 to 2012, both templates will be available. To make use of the new functionality in the process template, you will need to create new instances to replace the previous instances created by the Unix Service Template.
Performance and Cookdown Considerations
Each unique process name that is specified in a process template will involve one WSMan query to the agent per polling interval. Multiple template instances that inspect a single process name but implement unique regular expression filtering will cookdown into a single WSMan query to the agent per polling interval. For example, if ten process template instances target a single host and all monitor a process named java with distinct process argument filters (RegExp), only one WSMan query will be sent to the agent per polling interval. If ten process template instances target a single host and each monitors a unique process name (processA, processB, etc.), ten WSMan queries will be sent to the agent per polling interval.
In cases where a large number of unique process names need to be monitored, process argument filtering is not required, and the monitored agents do not have a large number of running processes (with sizable parameter strings), custom MP authoring can be used to create a cookdown-optimized monitor type that enumerates SCX_UnixProcess with the filter: Select Name, Parameters from SCX_UnixProcess. This would allow all of the process monitors to cookdown to a single WSMan query assuming all other configuration parameters (such as Interval) are aligned.
Hi Kris,
thanks for that cool blog post! It’s good to see the improvements in that area.
cheers,
Stefan
Awesome development- huge improvement.
Hello,
how can I use the Process Monitoring Template to monitor a process which can run on two server but should only run once (hostgroup with shared process)?